I See Everything My Agent Does. In My Own Environment. No Cloud Account.
Your choices used to be free but heavy, easy but hosted, or self-hosted for an enterprise fee. Nobody offered the fourth option — free, easy and local. One pip install, one command, one SQLite file, nothing leaving your machine.
Jun 4, 2026 · Upendra Bhandari · Observability
Here's what it takes to see your first agent trace in most observability tools.
Sign up. Verify email. Create an organization. Generate an API key. Add the key to your environment. Install the SDK. Read the docs on how to configure the exporter. Run your agent. Open the dashboard. Wait for the trace to appear in their cloud. Hope your security team doesn't ask why customer data is now on a third-party server.
Here's what it takes with FastAIAgent:
pip install "fastaiagent[ui]"
fastaiagent ui
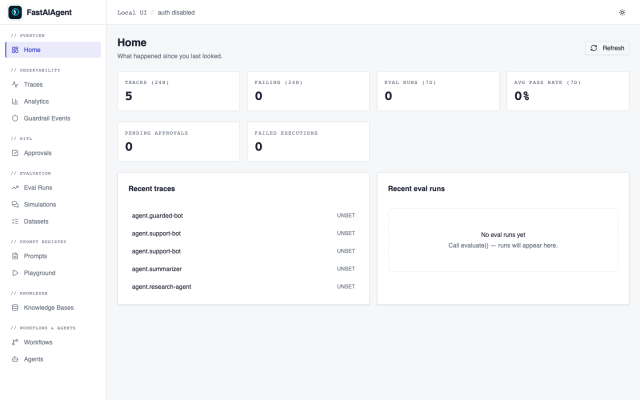
Your browser opens to localhost:7842. Every trace, prompt, eval, and guardrail event your agent has produced is right there. No account. No API key. No data leaving your machine.
That difference isn't convenience. It's a different philosophy about whose data this is.
The infrastructure tax nobody mentions
The open-source observability tools are genuinely good. Real engineering, real features, permissive licenses. "Self-hostable" and "free" right on the box.
Then you read the deployment guide.
The leading self-hosted options require a relational database, a columnar analytics database, a cache layer, blob storage, and a container orchestrator for production scale. That's five services to stand up before you see a single trace. The "free" tool costs you a DevOps afternoon, a Helm chart, and someone on your team who understands database performance and cluster scaling.
The tools that don't require infrastructure solve the problem by hosting everything themselves. Which means your traces, your prompts, your agent's internal reasoning, your customers' data in those traces, all live on someone else's servers. Self-hosting those is usually an Enterprise contract conversation.
So your choices are:
- Free but heavy — stand up five services and a cluster
- Easy but hosted — ship your data to a vendor's cloud
- Self-hosted and easy — pay for an Enterprise plan
Nobody offers the fourth option: free, easy, and local. pip install and a single command, with everything running in your own environment and nothing leaving it.
That's the gap FastAIAgent fills.
Everything in one file
The entire Local UI reads from a single SQLite file: ./.fastaiagent/local.db in your project folder.
Traces. Spans. Prompts and their versions. Eval runs and results. Guardrail events. Saved filters. Full-text search indexes. All of it, one file. No Postgres. No ClickHouse. No Redis. No S3. No Docker. No Kubernetes.
When you delete the .fastaiagent folder, the data is gone. There's no cloud to clean up, no account to close, no data retention policy to read. The data is a file. You own the file.
This matters most where it's not optional:
Regulated industries — finance, healthcare, defense. Customer data in agent traces cannot go to a third-party SaaS without a compliance review that takes months. A local SQLite file sidesteps the entire question.
Air-gapped deployments — no internet egress allowed. Cloud observability is simply impossible. Local-first is the only option.
Early development — you're iterating on a prototype at 11pm. You don't want to create an account and read exporter docs. You want to see what your agent did. One command.
Your traces never leave your environment. Not as a feature you enable. As the default, because there's nowhere else for them to go.
And here's the part that makes this different from bolting on a separate observability tool: this isn't a separate observability tool. The traces, the prompts, the evals, the guardrail events — they're produced by the same SDK that runs your agents. You didn't integrate FastAIAgent with an observability platform. The observability is the harness watching itself. That's why Agent Replay can exist and why a failure can become a test in one click — the pieces share one data model because they're one system. You're not assembling a stack. You installed one thing.
When you outgrow a file
A single SQLite file is perfect for one developer. When your team needs to share observability — when someone other than you needs to see what production agents did — you'll want a shared backend.
And here's the honest part: SQLite is single-writer, single-machine. For development and moderate production, that's not a weakness — it's the whole reason there's zero setup. But it has a ceiling. Run a lot of agents at once, all writing traces, and one writer becomes a bottleneck. Spread them across machines and a local file can't be the shared truth. SQLite is right for where most projects start, and where many stay — but high-volume, multi-machine production will hit its edges. No point pretending otherwise.
Which is why Postgres is coming. Same UI, pointed at a Postgres connection instead of a file — a backend built for concurrent writers and volume. And still just one connection, not the five-service stack the heavier tools want. Start with a file, grow to a connection string, never stand up a cluster.
And beyond that, for organizations that need the full picture, there's an enterprise platform on the way — on-prem or managed SaaS — with the things a regulated, multi-team deployment actually requires: shared team observability, access controls, audit trails, governance and compliance, and fleet-level visibility across many agents in production. The open-source harness is the foundation; the platform is what makes it deployable at the scale and under the controls an enterprise demands. More on that soon.
For today, the Local UI is SQLite, single-machine, and zero-infrastructure. That's the right starting point, and for most development it's all you need. The path from here — file, to shared database, to enterprise platform — is one continuous line, not a series of tool migrations.
A few surfaces that prove it
The Local UI has fifteen-plus surfaces. Here are the three that show why this approach matters.
Traces — the thing you actually came for
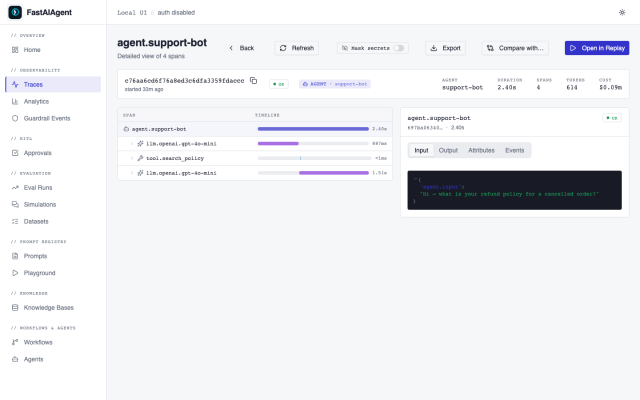
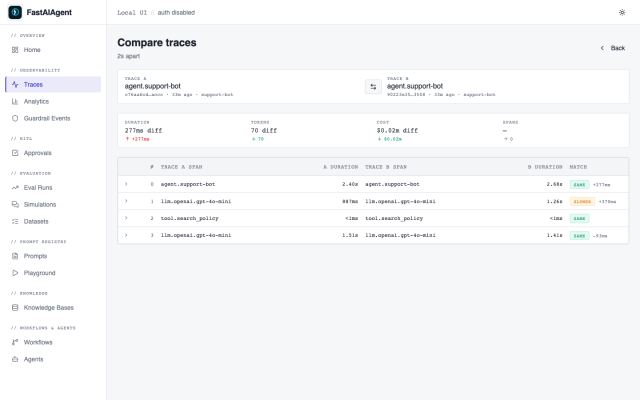
Every agent.run() produces a trace. Open the Traces page and you see the full list: trace name, status, duration, tokens, cost, and the framework that produced it. Click one and you get the span tree — every LLM call, tool invocation, and retrieval, with full inputs and outputs.
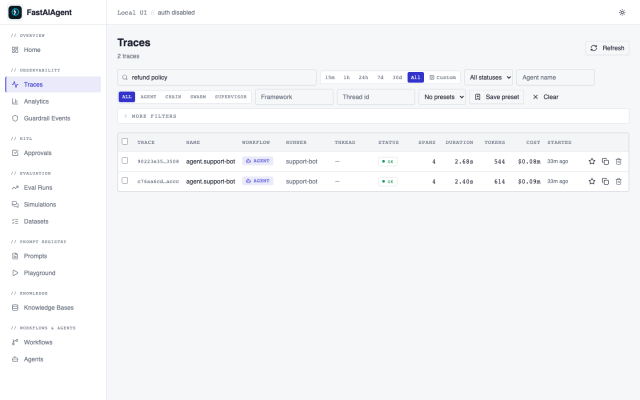
Full-text search works across span inputs and outputs. Type "refund policy" and you find every trace where that phrase appeared in what the agent sent or received. That search runs against a local FTS index — instant, no network round-trip, no per-query cost.
Agent Replay — debug without redeploying
Find a trace where the agent went wrong. Click the failing span. Fork it. Change the prompt, the input, the tool response, or the LLM parameters. Rerun from that exact step. See the original and the new output side by side, with the divergence point highlighted.
No other observability tool does this, cloud or local. They show you what happened. Replay lets you change what happened and see the result. (Earlier posts in this series go deep on it — it's the heart of the series.)
Cost tracking — where your money goes
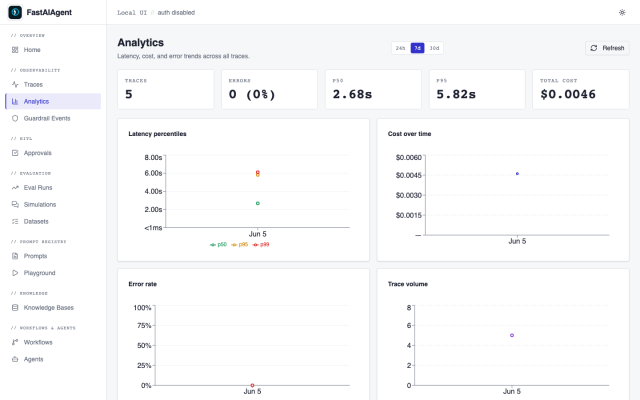
The Analytics page breaks down spend by model, by agent, and by node. You see that 80% of your cost is the research agent calling GPT-4o, and the summarizer on GPT-4o-mini is basically free. You optimize the expensive path and cut your bill.
Computed on read, from the token counts already in your traces. No cloud aggregation, no data warehouse, no per-event pricing.
One install, not eight
Step back from observability for a second and look at what you actually installed.
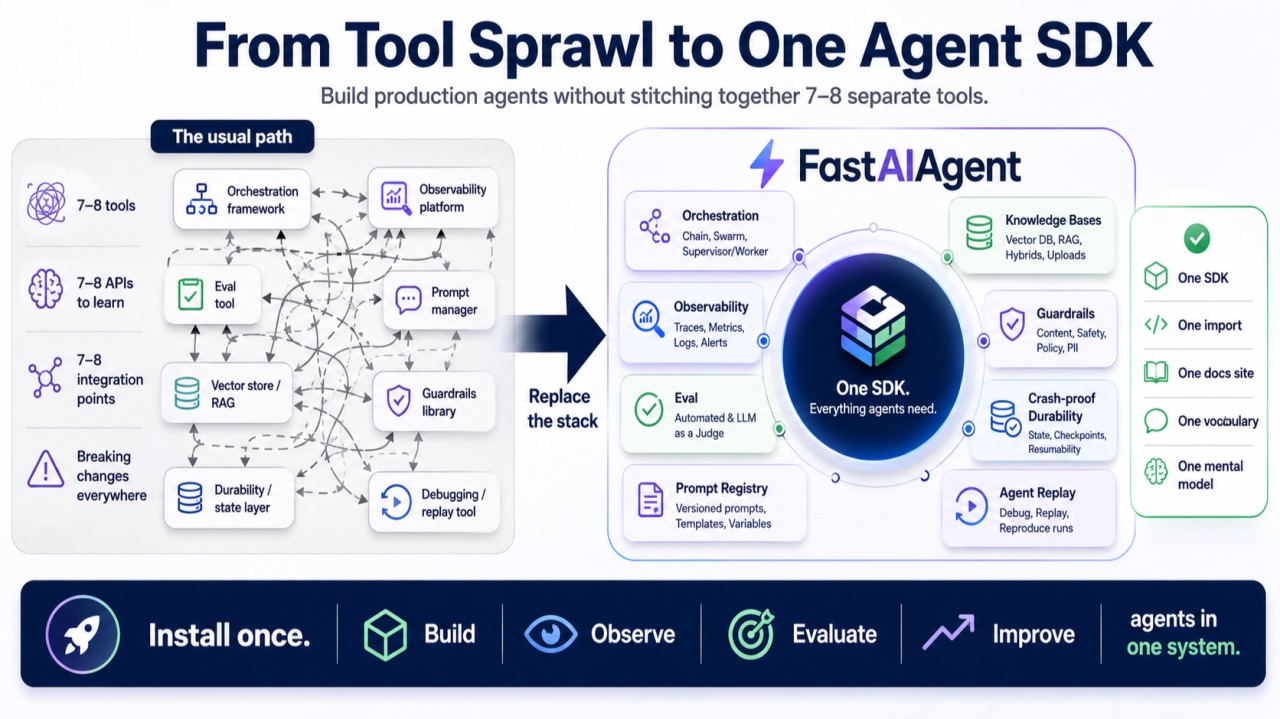
To build a production agent today, the usual path is to assemble a stack: an orchestration framework, a separate observability platform, an eval tool, a prompt manager, a vector store for RAG, a guardrails library, and something for durability. Seven or eight tools. Seven or eight APIs to learn. Seven or eight integration points to wire together and keep working as each one ships breaking changes.
What you installed with pip install fastaiagent is all of that, in one SDK, with one mental model. Orchestration (Chain, Swarm, Supervisor/Worker). Observability (everything in this article). Eval. Prompt registry. Knowledge bases. Guardrails. Crash-proof durability. Agent Replay. One import. One docs site. One vocabulary.
Built together, not bundled
This isn't "we bundled eight tools." It's that the pieces were built together, so they share one data model. The trace feeds the replay. The replay becomes an eval case. The eval references a prompt version. The guardrail event shows up in the same UI as the trace that triggered it. None of that wiring is something you set up — it's there because it's all one system.
The practical payoff is the learning curve. You don't learn how one tool's state model maps to another tool's trace model maps to a third tool's eval case model. You learn one model: an agent runs, the run produces a trace, the trace can be replayed, the replay can become a test. That's the whole vocabulary. Everything in this series — Replay, durability, prompts, eval, guardrails, multimodal — is the same SDK seen from a different angle.
The Local UI is just the window into a harness that was complete before you opened it.
But what about the observability tools I already use?
There's a fair objection here: there are already excellent open-source tools that give you tracing, eval, prompt management, and a gateway locally, for free, with a huge community. If one of those covers observability, why does it matter that ours is built into the SDK?
Because those tools observe agents — they don't run them. They're the watching layer wrapped around a separate framework you still have to build and run your agent in. That's a perfectly good design, and they're more mature at pure observability than we are. But it has a hard ceiling: a tool that only watches can't fork a failed step, change one variable, and rerun it. It can't resume an execution after a crash, because it never controlled the execution. It can't block a bad action mid-flight — only flag it afterward. Replay, durability, and runtime guardrails all require owning the execution loop. An observability tool that wraps someone else's framework structurally cannot reach them, no matter how good its dashboards get.
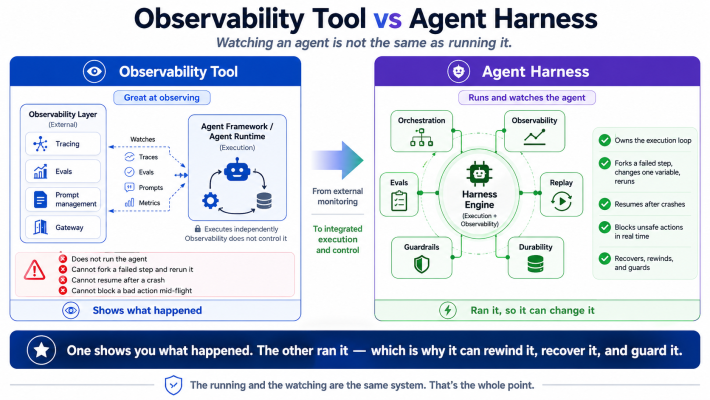
That's the difference between an observability tool and an agent harness. One shows you what happened. The other ran it — which is why it can also rewind it, recover it, and guard it. We didn't bolt observability onto a framework, and we didn't build observability that wraps a framework. The running and the watching are the same system. That's the whole point.
Why this is the right default
There's a deeper reason this matters beyond compliance and convenience.
When observability requires shipping your data to a vendor, you instrument less. You sample traces to control costs. You redact sensitive fields. You think twice about what you log. The friction of "this goes to the cloud" makes you capture less than you should.
When observability is a local file with no marginal cost and no data-egress concern, you capture everything. Every trace, full fidelity, full inputs and outputs, no sampling. The richest possible picture of what your agent actually did, because there's no reason not to.
The best debugging happens when you have complete information. Local-first gives you complete information by default, because the data never has to go anywhere.
pip install fastaiagent, fastaiagent ui, and see everything your agent does. In your own environment. No cloud account.
FastAIAgent is an open-source agent harness with Agent Replay, crash-proof durability, and a local-first UI. pip install fastaiagent — the SDK is on GitHub.
 {{ meta.author }}